
The Quality Control of Advanced Ceramic Products by the Bettersizer S3 Plus
2022-12-13Application Note
The global demand for advanced ceramics, with the unique thermal, wear, and corrosion resistant capabilities, in biomedical, aerospace industry, precision tools, electronics, and environmental fields is on the increase. Optimizing and controlling the particle size distribution of powder to improve the microstructure of ceramic products are crucial to the final performances. The Bettersizer S3 Plus and BT-A60 autosampler can provide ceramic powder producers and ceramic product manufacturers with a highly automatic and time-saving method for measuring large numbers of samples. The high performances and the combination of dynamic image analysis enable the Bettersizer S3 Plus to be a reliable and powerful tool for quality control during any process of ceramic production.
| Product | Bettersizer S3 Plus |
| Industry | Ceramics |
| Sample | Alumina powder |
| Measurement Type | Particle size, Particle Shape |
| Measurement Technology | Laser Diffraction, Dynamic Image Analysis |
Jump to a section:
- Introduction
- Case study 1: Measuring the PSD of alumina powder samples automatically
- Case study 2: Determining the uniformity of alumina powder
- Case study 3: The detection of alumina agglomerates
- Conclusion
Introduction
The global demand for ceramic materials with wide ranging applications in biomedical, aerospace industry, precision tools, electronics, and environmental fields is on the increase. Advanced ceramics expand on the unique thermal, wear, and corrosion resistant capabilities of traditional ceramics by increasing toughness. One of the main methods to improve the mechanical properties is using high-purity and ultra-fine inorganic non-metalic powder as raw materials to optimize the microstructure of ceramic products. [1] The particle size distribution (PSD) of ceramic powder plays a vital role in green density, green strength, and shrinkage and further influences the performances of final products. Thus, to whether the ceramic powder producers or the ceramic product manufacturers, accurately controlling the PSD is indispensable for the quality control.
Difficulties and requirements for quality control of ceramic powder:
- During the production of ceramic powder, the product needs to be sampled and detected from lines regularly for ensuring the stability of quality and saving the measurement data for traceability. However, due to the huge numbers of samples, particle size measurement is a time-consuming and repetitive work increasing the cost of quality control.
- Adjusting the PSD by mixing the finer and coarser powder in a certain proportion is a common method to increase the green density. The uniformity of mixed powder will determine the success of sintering. A feasible method is required to monitor the uniformity.
- The particle size of ultra-fine ceramic powder is commonly submicron-scale. The traditional PSD measurement method such as sieving is not feasible for measuring such fine powder. For the laser diffraction technology (LD), there are also challenges in terms of the performances of analyzers.
- During calcination and desiccation of ceramic powder, the fine ceramic particles are prone to agglomerate. The small amounts of oversized particles always become defects of products and reduce the product qualification rate. Discovering them before using is critical to quality control. But the LD method does not allow showing the images of oversized particles, it is questionable whether they really exist or not.
The Bettersizer S3 Plus combines laser diffraction and dynamic image analysis in one instrument. The laser diffraction system provides high precision, sensitivity and resolution for even submicron-scale particle measurements. The dynamic imaging system can visualize the dispersion process, capture the images of oversized particles and give the shape information for helping users to analyze what happen to their powder products.
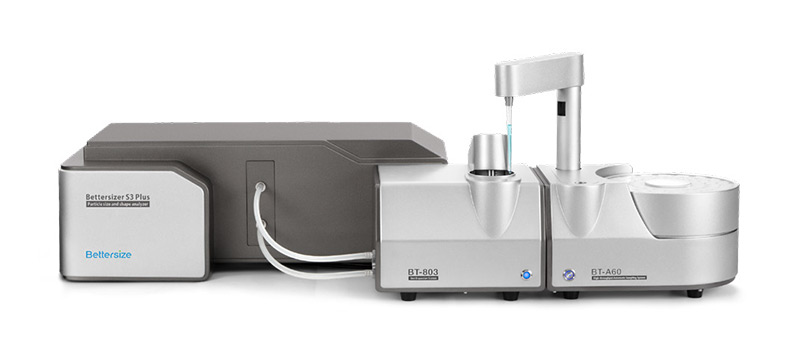
Figure 1. The Bettersizer S3 Plus, and BT-A60 autosampler
Case study 1: Measuring the PSD of alumina powder samples automatically
In this case study, 60 alumina powder samples (5 alumina powders with different PSDs, alumina A~E, each alumina powder was divided into 12 samples) were automatically measured in a single run by the Bettersizer S3 Plus and BT-A60 autosampler. The BT-A60 is a high-throughput autosampler. Compatible with the Bettersizer S3 Plus, it can provide fully automated sample analysis.
Before measurements, the 60 powder samples were ultrasonically dispersed in aqueous solutions with sodium metaphosphate in 60 sample tubes. Each tube was affixed with a bar code corresponding to an SOP edited in advance and saved in the software. When the measurement begins, the working process is:
- The BT-A60 scans the bar code, identifies the sample and selects the SOP;
- The sampling needle of the BT-A60 extracts the suspension in the sample tube and injects it into the dispersion pool, and then performs the measurement;
- The sampling needle is ultrasonically cleaned and proceed to next measurement.

Figure 2. The D10, D50 and D90 of the 60 samples (unit: um)
Figure 2 shows the D10, D50 and D90 of the 60 alumina powders. Before extracting the suspension from sample tubes, for keeping the suspension uniformly, suction and injection were automatically performed several times with the sampling needle. The 12 samples of each alumina powder show a good reproducibility. The PSD result of each measurement was saved in the software automatically.
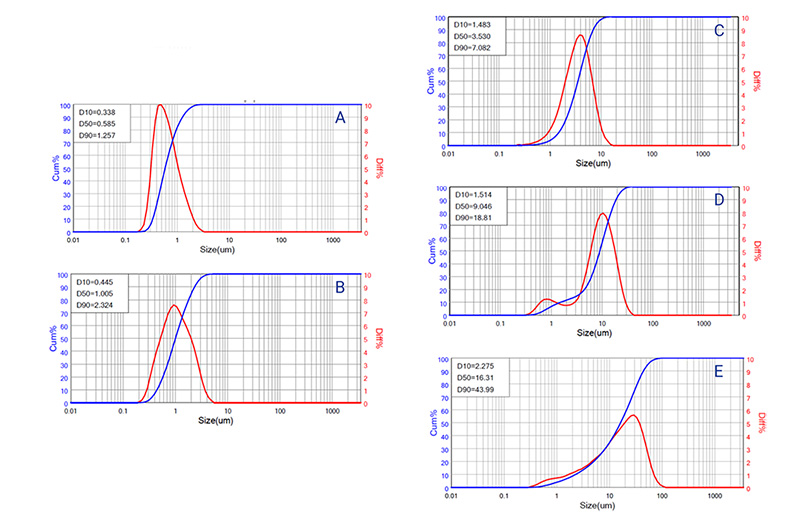
Figure 3. The PSD and cumulative curves of sample A, B, C, D and E
Figure 3 shows the PSD and cumulative curves of 5 alumina powders. Alumina A, B and C have relatively narrower monodistribution and alumina D has a wider bimodal distribution. The different shapes of PSD curves indicate their different preparation and processing methods.
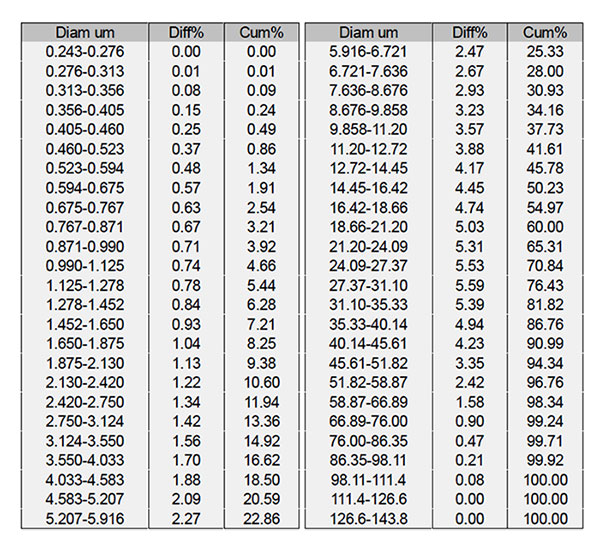
Table 1. The PSD of sample E
The content of coarse particles in fine powder is an important indicator owing to the defects always formed by the coarse particles. With proper processing methods such as milling and sieving, most coarse particles can be removed. Alumina E is the raw material that has not been milled and sieved. According to the cumulative content shown in Table 1, the volume percentage of particles over 45 um in sample E is about 9 %.
The usage of the Bettersizer S3 Plus and BT-A60 autosampler provides a highly automatic and convenient method for particle size measurements of large numbers of samples.
Case study 2: Determining the uniformity of alumina powder
Poor uniformity of the ceramic powder will cause the nonuniform microstructure of the products and low mechanical strength. Many techniques and mixers have been developed for obtaining an ideal mixing uniformity. At the same time, finding an easy method to monitor the mixing effect is also essential for quality control.
In this case study, we measured 2 mixed ceramic powders. They were all produced by mixing a finer alumina powder (D50 is about 0.5 um) and a coarser alumina powder (D50 is about 3.0 um). The difference was that one was mixed by the dry method (without water) and one by the wet method (with water). Before measurement, each mixed powder was sampled 5 times at different spots. The Bettersizer S3 Plus and BT-803 wet dispersion unit were used to measure the particle size distribution of the 10 samples.
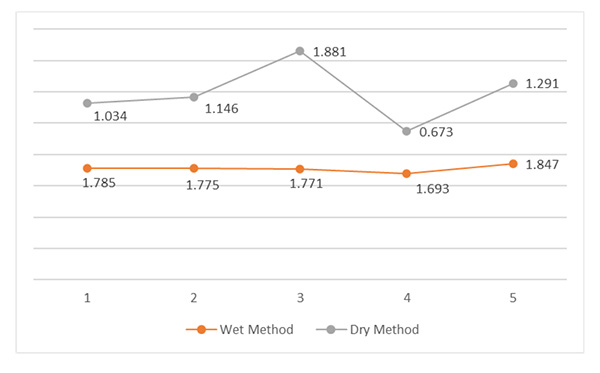
The D50 of each sample of the mixed powders is shown in Figure 4. The D50 of the sample mixed by dry method shows a severe fluctuation, indicating that the proportions of the finer and the coarser particles are quite different. The D50s of the wet mixed sample are more consistent, indicating it has a good uniformity.
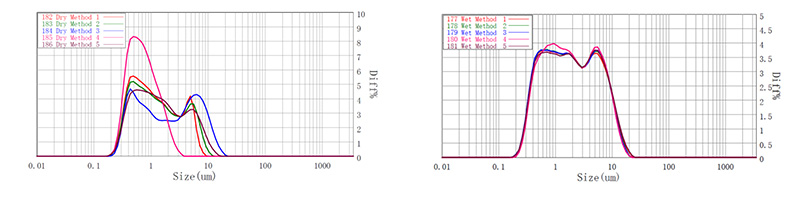
Figure 5. The PDS curves of the dry mixed alumina powder
and wet mixed alumina powder
From the PSD curves in Figure 5, it can be seen that the reproducibility of the dry mixed powder is extremely poor. The dry mixed sample 3 has the most content of big particles compared with other samples, whereas the sample 4 has almost only small particles. The PSD curves of the wet mixed powder show a good consistency. The excellent reproducibility indicates the wet method may be more suitable for mixing such fine ceramic powders.
Case study 3: The detection of alumina agglomerates
Unexpected oversized particles in fine ceramic powder always indicate the degradation of quality and variation of manufacture and processing conditions. When oversized particles appear on the PSD curve unpredictably, confirming the existence of them is significant. The dynamic imaging system of the Bettersizer S3 Plus was used here to detect the agglomerates in the ultra fine alumina powder and to provide the images and shape information for analysis.
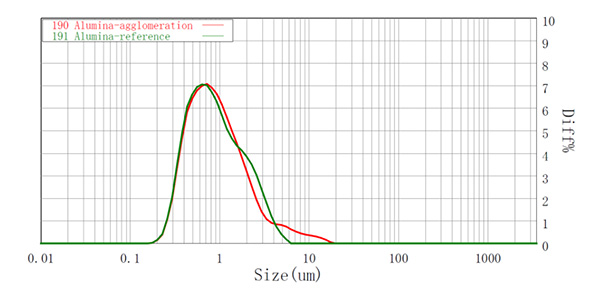
Figure 6. The PSD curves of Alumina powder.
Figure 6. shows the PSD curves of 2 batches of alumina powder with the same model. Compared to the reference batch, there are some oversized particles in the range of 6 um to 20 um in the abnormal batch. It might be caused by agglomeration of ultra-fine alumina particles during the production process. To make sure that the agglomerates do exist, the measurement parameter was set to capture the particles from 6um to 20um.

Figure 7. The images of oversized particles.
The images of oversized particles (shown in Figure 7) were captured by high-speed CCD cameras. Through image analysis, the particle diameters were given (the numbers above the images). With the captured images, the existence of the oversized particles are confirmed.
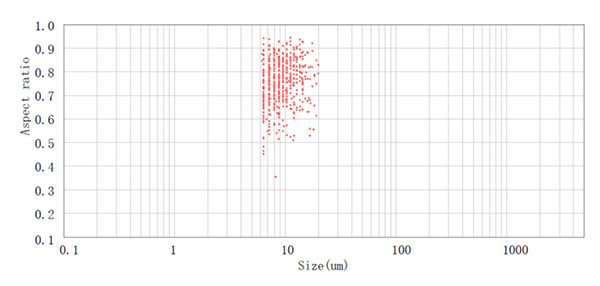
Figure 8. The scatter plot of particles in the range of 6~20 um.
The particles in the range of 6~20 um were counted in the scatter plot, shown in Figure 8. Combining the images and the scatter plot of aspect ratio, we can determine that the abnormal PSD curve is caused by amounts of irregular alumina agglomerates. The appearance of agglomerates may also manifest that there are some unstable factors in the manufacturing process, which need to be checked and improved.
Conclusion
The Bettersizer S3 Plus and BT-A60 autosampler can provide ceramic powder producers and ceramic product manufacturers with a highly automatic and time-saving method for measuring large numbers of samples. The high performances and the combination of dynamic image analysis enable the Bettersizer S3 Plus to be a reliable and powerful tool for quality control during any process of ceramic production.
Reference
[1] T. A. Otitoju, P. U. Okoye, G. Chen, Y. Li, M. O. Okoye, and S. Li, Advanced Ceramic Components: Materials, Fabrication, and Applications, Journal of Industrial and Engineering Chemistry, 2020, Volume 85, 34-65
About the Author
 |
Jing Cao Application Engineer @ Bettersize Instruments |
Rate this article